Course
This lesson is a part of our OpenTelemetry masterclass. If you haven't already, checkout the chapter introduction.
Each lesson in this lab builds on the last one, so make sure you read the workshop introduction before proceeding with this one.
Now that you’re sending your data to New Relic, use our platform to visualize and analyze your OpenTelemetry data.
First, go to New Relic:

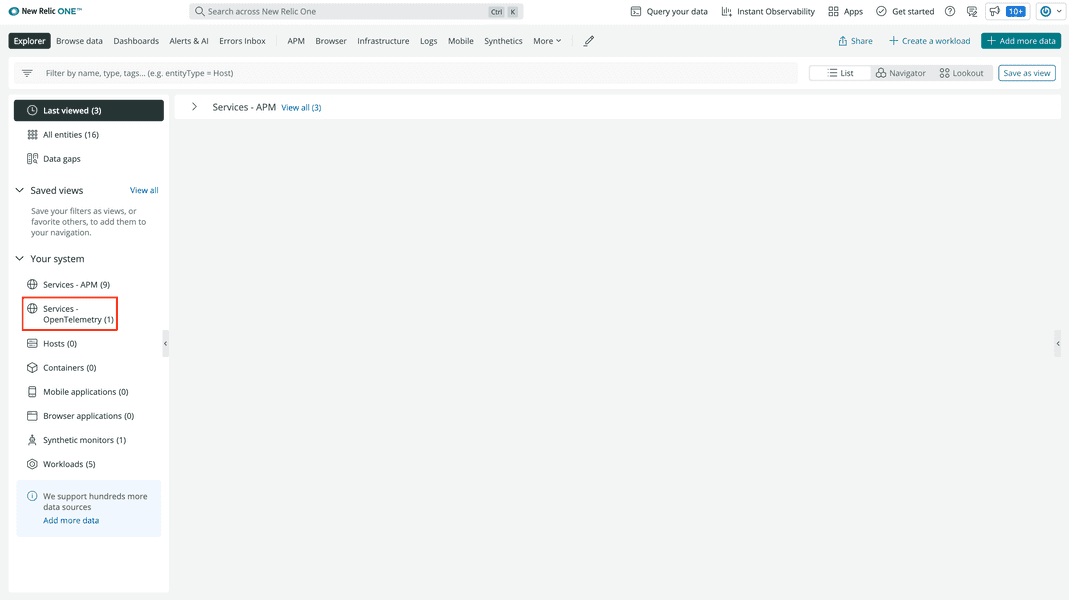
Notice the OpenTelemetry service in the left-hand navigation on your account homepage.
Troubleshooting
You may have to wait a few minutes before seeing your results in New Relic. If you’re still not seeing results, remember to set your environment variable NEW_RELIC_API_KEY to your New Relic license key:
$export NEW_RELIC_API_KEY=<YOUR_LICENSE_KEY>Also, check your code against ours to make sure you correctly instrumented your application.
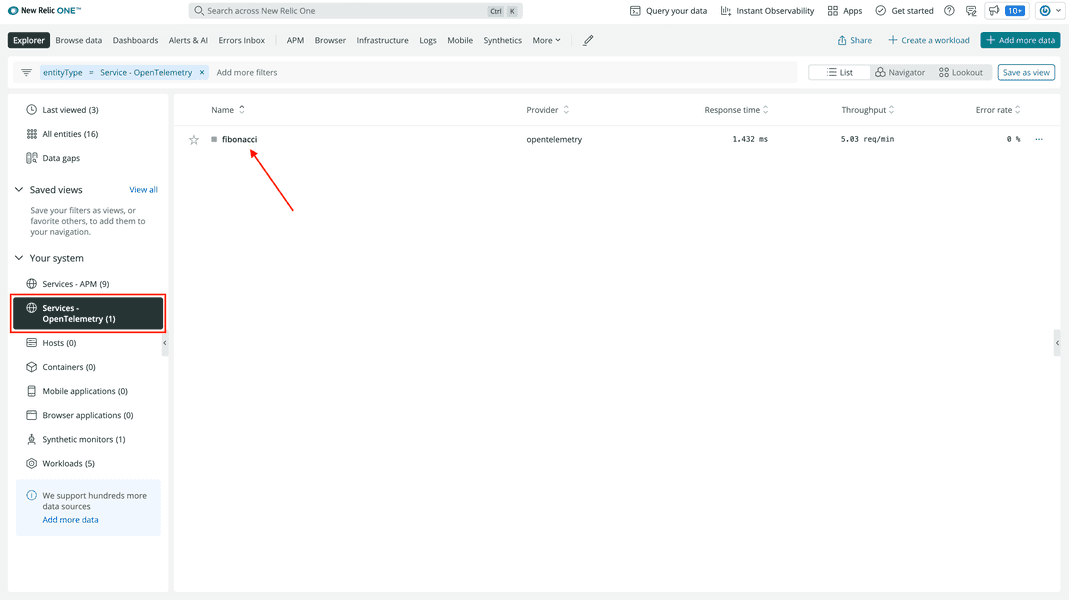
Select Services-OpenTelemetry from the left-hand navigation, then choose fibonacci, which is the service name you specified when you instrumented your application:

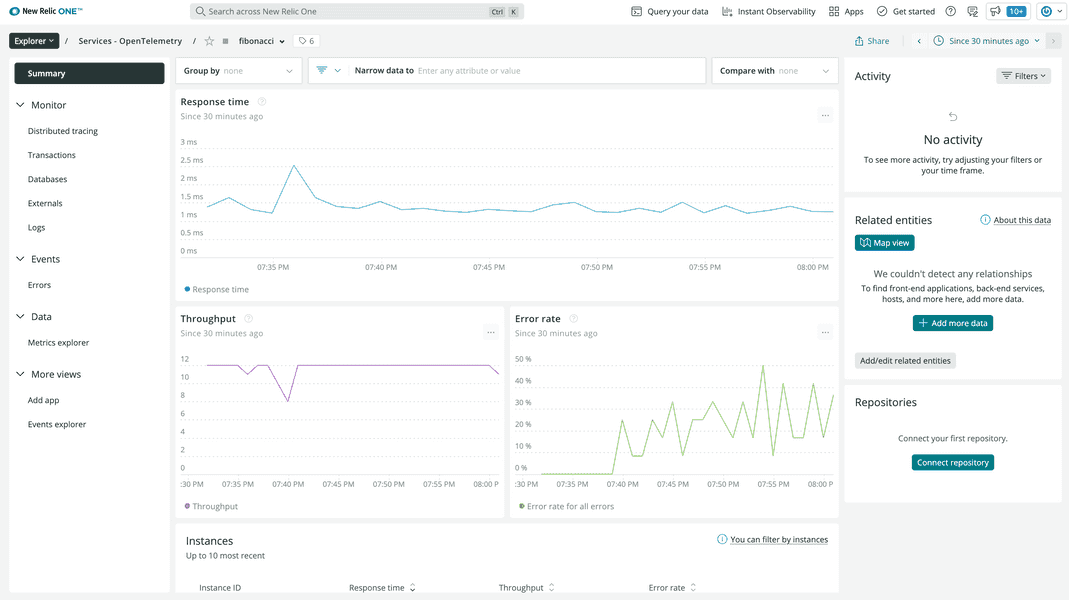
Here, you see a summary of your OpenTelemetry service:

With only a few lines of OpenTelemetry instrumentation code, you see response times and the number of requests for your service. You also see a chart for the Error rate in your service.
Because you instrumented your application with the tracing API, head over to distributed tracing to view your trace data.
Course
This lesson is a part of our OpenTelemetry masterclass. Continue on to the next lesson: View your traces.